I am creating my first state diagram in Tikz. It is finished, except for the text alignment.
As you can see with the code I included here, I cannot figure out how to get the text off of the arrows. Also, the text on the middle arrow would look better if it matched the angle of the arrow. I looked online, but it seems there are many very different ways people like to code their Tikz diagrams. It makes it hard to find a solution that is applicable to what I have.
I would greatly appreciate any help with this! I am just now learning Tikz, and it is pretty overwhelming.
\documentclass[10pt]{article}
\usepackage{amsmath,amssymb,theorem}
\usepackage{caption}
\usepackage{tikz}
\usetikzlibrary{arrows.meta, automata, positioning, quotes}
\newif\ifpdf
\ifx\pdfoutput\undefined
\pdffalse % we are not running PDFLaTeX
\else
\pdfoutput=1 % we are running PDFLaTeX
\pdftrue
\fi
\ifpdf
\usepackage[pdftex]{graphicx}
\else
\usepackage{graphicx}
\fi
\textwidth = 6.5 in
\textheight = 9 in
\oddsidemargin = 0.0 in
\evensidemargin = 0.0 in
\topmargin = 0.0 in
\headheight = 0.0 in
\headsep = 0.0 in
\parskip = 0.2in
\parindent = 0.0in
\ifpdf
\DeclareGraphicsExtensions{.pdf, .jpg, .png}
\else
\DeclareGraphicsExtensions{.eps, .jpg}
\fi
\begin{document}
\begin{figure}[h]
\centering
\begin{tikzpicture}
[
node distance = 10mm and 30 mm,
inner sep=5pt,
every edge/.append style = {draw, -{Straight Barb[scale=0.8]}},
every edge quotes/.style = {auto=center, font=\small, inner sep=10pt}
]
% nodes
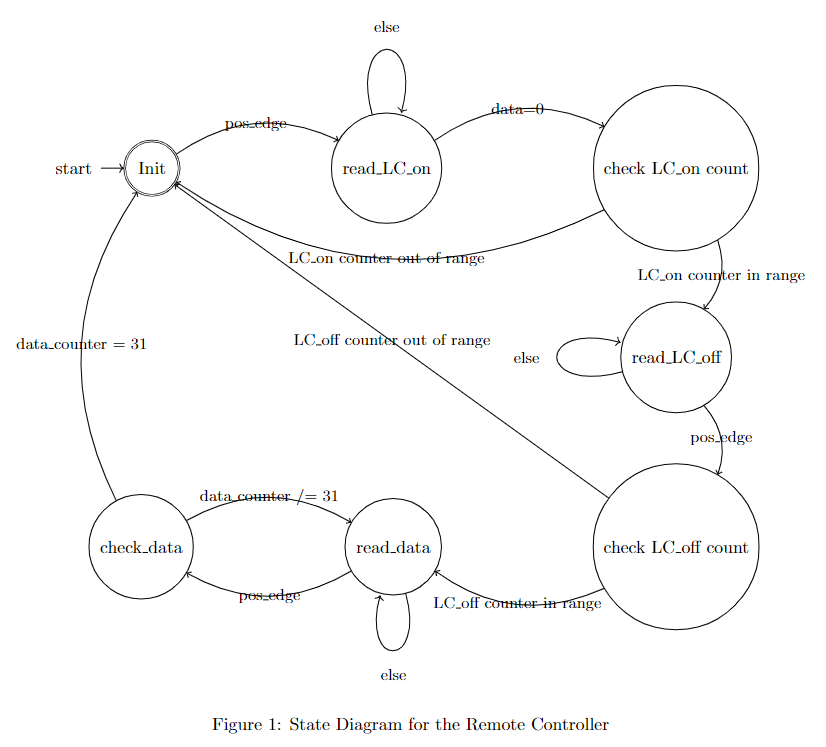
\node[state, initial, accepting] (1) {Init};
\node[state, right= of 1] (2) {read\_LC\_on};
\node[state, right= of 2] (3) {check LC\_on count};
\node[state, below= of 3] (4) {read\_LC\_off};
\node[state, below= of 4] (5) {check LC\_off count};
\node[state, left= of 5] (6) {read\_data};
\node[state, left= of 6] (7) {check\_data};
% arrows
\path (1) edge[bend left, "pos\_edge"] (2)
(2) edge[loop above,"else"] ()
edge[bend left, "data=\‘0\’"] (3)
(3) edge[bend left, "LC\_on counter \“out of range\”"] (1)
edge[bend left, "LC\_on counter \“in range\”"] (4)
(4) edge[loop left,"else"] ()
edge[bend left, "pos\_edge"] (5)
(5) edge["LC\_off counter \“out of range\”"] (1)
edge[bend left, "LC\_off counter \“in range\”"] (6)
(6) edge[bend left, "pos\_edge"] (7)
edge[loop below,"else" '] ()
(7) edge[bend left, "data\_counter /= 31"] (6)
edge[bend left, "data\_counter = 31"] (1);
\end{tikzpicture}
\caption{State Diagram for the Remote Controller}
\label{fig:my_label}
\end{figure}
\end{document} csquotes