Hi Phredd,
welcome to the forum!
Sure, there's no need to post your whole report. But there's something between a small code snippet and the whole report, right?

If you would post a compilable example, a reader could test and improve it in the desired way. Without compiling, it stays a bit theoretical.
So, without the Feynman diagram (it would have been nice to see it), I guess it just has the base line for vertical alignment at the bottom. The base line for the
aligned math environment is at it's center (but can be changed to top or bottom line). In the table, the base lines are aligned next to each other. So you see the diagram going upwards above the base line, the math text at the base line stays low. It's base line alignment, not top alignment.
You can change it in different ways, such as using
\raisebox, the
 adjustbox
 package, or the
stackengine package.
With
stackengine loaded, you can use
\belowbaseline[0pt]{your diagram} and
\belowbaseline[0pt]{$math formula$} for top alignment. Or
\Centerstack for middle alignment.
In contrast to m columns, you don't need a fixed width.
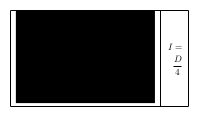
- centered.png (905 Bytes) Viewed 7335 times
Done by:
Code: Select all
\documentclass{article}
\usepackage[demo]{graphicx}
\usepackage{amsmath}
\usepackage{stackengine}
\begin{document}
\begin{table*}[t]
\centering
\begin{tabular}{|c|c|}
  \hline
  \Centerstack{\includegraphics{diagram}}
    &
  $\begin{aligned} I &= \\
  &\frac{D}{4} \end{aligned}$\\
\hline
\end{tabular}
\end{table*}
\end{document}
Here with top alignment:
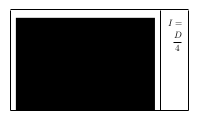
- mwe.png (948 Bytes) Viewed 7335 times
Code: Select all
\documentclass{article}
\usepackage[demo]{graphicx}
\usepackage{amsmath}
\usepackage{stackengine}
\begin{document}
\begin{table*}[t]
\centering
\begin{tabular}{|c|c|}
  \hline
  \belowbaseline[0pt]{\includegraphics{diagram}}
    &
  \belowbaseline[0pt]{$\begin{aligned} I &= \\
    &\frac{D}{4} \end{aligned}$}\\
\hline
\end{tabular}
\end{table*}
\end{document}
Stefan

