I have an array of numbers, ZX, as follows of size N=12.
- -1.0000000000000000
-0.94489927222288217
-0.81927932164400663
-0.63287615303186073
-0.39953094096534891
-0.13655293285492756
0.13655293285492756
0.39953094096534891
0.63287615303186073
0.81927932164400663
0.94489927222288217
1.0000000000000000
Depending on N, these values of ZX change. ZX always remain in the range (-1,1). I want to make a square with corners at (-1,-1) to (1,1) and have lines inserted based on the values of ZX as shown in the following figure (in this case N=5):
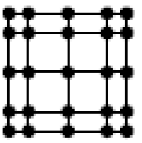
- collocation points.png (12.98 KiB) Viewed 4808 times
I don't know how can I use the values of an array to plot lines in Tikzpicture. Can someone help me here?
Thanks
