Graphics, Figures & TablesHigh-Quality Function Plots

Information and discussion about graphics, figures & tables in LaTeX documents.
Post Reply
cruzel
Posts: 2
Joined: Sun Feb 03, 2013 7:53 pm

High-Quality Function Plots

Post by cruzel »

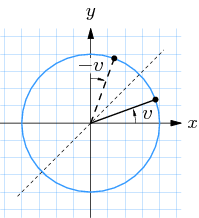
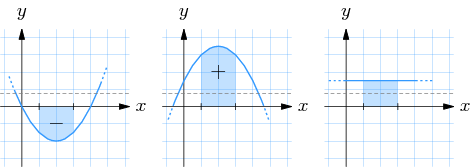
Today I stumbled over a page with very nice plots, but wasn't able to find any hints there, how they were created. Must be a done with latex I think, as the rest of the page is also based on latex equations and the downloadable pdf is created with pdftex. Does anybody know which extension they use?

Example images:
Image

Image

-cruzel

Recommended reading 2024:

LaTeXguide.org • LaTeX-Cookbook.net • TikZ.org

NEW: TikZ book now 40% off at Amazon.com for a short time.

And: Currently, Packt sells ebooks for $4.99 each if you buy 5 of their over 1000 ebooks. If you choose only a single one, $9.99. How about combining 3 LaTeX books with Python, gnuplot, mathplotlib, Matlab, ChatGPT or other AI books? Epub and PDF. Bundle (3 books, add more for higher discount): https://packt.link/MDH5p

localghost
Site Moderator
Posts: 9202
Joined: Fri Feb 02, 2007 12:06 pm

High-Quality Function Plots

Post by localghost »

No bigger problem with PGF/tikZ.


Alternatives:

Best regards and welcome to the board
Thorsten
cruzel
Posts: 2
Joined: Sun Feb 03, 2013 7:53 pm

Re: High-Quality Function Plots

Post by cruzel »

Thanks for your quick answer and the welcome greetings!
I will try the packages you mentioned :-)

-cruzel
User avatar
localghost
Site Moderator
Posts: 9202
Joined: Fri Feb 02, 2007 12:06 pm

High-Quality Function Plots

Post by localghost »

Just a short followup. Such drawings might be drawn easier by some packages which are build on PGF/tikZ but offer some enhanced macros. The packages in question are e.g.
Unfortunately the manuals of those packages are only available in French. So you have to learn by the examples.
Post Reply