Graphics, Figures & TablesDiagrams in the complex Plane, Markov Maps

Information and discussion about graphics, figures & tables in LaTeX documents.
Post Reply
tomosparry
Posts: 2
Joined: Wed Jul 18, 2012 8:53 pm

Diagrams in the complex Plane, Markov Maps

Post by tomosparry »

Hi,

I'd like to add in several diagrams into a LaTeX document I'm doing. The diagrams fall into two types:
  1. diagrams of isolated points, discs and half planes in the complex plane
  2. diagrams of Markov maps (these are maps of the unit interval into itself, where the unit interval is split into a finite partition; the point is I'd like vertical and horizontal lines highlighting the partition. As for what the function does, it will be any piecewise smooth map, with the discontinuities happening at the partition points)
Any help with any of those would be greatly appreciated.

Thanks very much.

Recommended reading 2024:

LaTeXguide.org • LaTeX-Cookbook.net • TikZ.org

Learn LaTeX easily with newest books:

The LaTeX Beginner's Guide: 2nd edition and perfect for students writing a thesis

The LaTeX Cookbook: 2nd edition full of practical examples for mathematics, physics, chemistry, and more

LaTeX Graphics with TikZ: the first book about TikZ for perfect drawings in your LaTeX thesis

User avatar
Stefan Kottwitz
Site Admin
Posts: 10350
Joined: Mon Mar 10, 2008 9:44 pm

Diagrams in the complex Plane, Markov Maps

Post by Stefan Kottwitz »

Hi tomosparry,

welcome to the board!

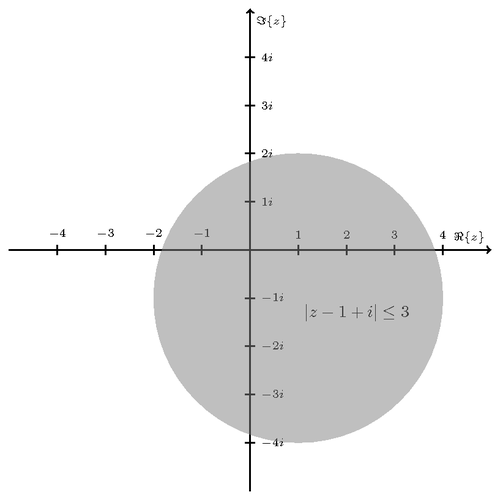
I would use TikZ for that. Here's an example, written by Martin Scharrer, copied from texample.net: Circle in the complex plane with TikZ.

Code: Select all

\documentclass{article}
\usepackage{tikz}
\begin{document}
\begin{tikzpicture}
    \begin{scope}[thick,font=\scriptsize]
    % Axes:
    % Are simply drawn using line with the `->` option to make them arrows:
    % The main labels of the axes can be places using `node`s:
    \draw [->] (-5,0) -- (5,0) node [above left]  {$\Re\{z\}$};
    \draw [->] (0,-5) -- (0,5) node [below right] {$\Im\{z\}$};

    % Axes labels:
    % Are drawn using small lines and labeled with `node`s. The placement can be set using options
    \iffalse% Single
    % If you only want a single label per axis side:
    \draw (1,-3pt) -- (1,3pt)   node [above] {$1$};
    \draw (-1,-3pt) -- (-1,3pt) node [above] {$-1$};
    \draw (-3pt,1) -- (3pt,1)   node [right] {$i$};
    \draw (-3pt,-1) -- (3pt,-1) node [right] {$-i$};
    \else% Multiple
    % If you want labels at every unit step:
    \foreach \n in {-4,...,-1,1,2,...,4}{%
        \draw (\n,-3pt) -- (\n,3pt)   node [above] {$\n$};
        \draw (-3pt,\n) -- (3pt,\n)   node [right] {$\n i$};
    }
    \fi
    \end{scope}
    % The circle is drawn with `(x,y) circle (radius)`
    % You can draw the outer border and fill the inner area differently.
    % Here I use gray, semitransparent filling to not cover the axes below the circle
    \path [draw=none,fill=gray,semitransparent] (+1,-1) circle (3);
    % Place the equation into the circle:
    \node [below right,darkgray] at (+1,-1) {$|z-1+i| \leq 3$};
\end{tikzpicture}
\end{document}
complex-plane.png
complex-plane.png (20.91 KiB) Viewed 3187 times
Browse the TikZ Example Gallery to see more examples, and have a look at the TikZ manual.

Stefan
LaTeX.org admin
tomosparry
Posts: 2
Joined: Wed Jul 18, 2012 8:53 pm

Re: Diagrams in the complex Plane, Markov Maps

Post by tomosparry »

Thanks very much, I'll give it a try!
Post Reply