Graphics, Figures & TablesSymbolic axis values - strange sequence

Information and discussion about graphics, figures & tables in LaTeX documents.
Post Reply
Gennaro90
Posts: 1
Joined: Sun Nov 05, 2017 8:40 pm

Symbolic axis values - strange sequence

Post by Gennaro90 »

Hello everyone, I tried to get symbolic values x1, x2, x3, x4 on x axis and C(x1),...,C(x4) on y axis.

Code: Select all

Code, edit and compile here:
\begin{tikzpicture}
\begin{axis}[
xlabel={$x$},
ylabel={$y$},
axis lines=center,
symbolic x coords={$x_1$, $x_2$, $x_3$, $x_4$, $x_5$},
symbolic y coords={$C(x_1)$, $C(x_2)$, $C(x_3),
$C(x_4)$, $C(x_5)$}]
\end{axis}
\end{tikzpicture}
הההההההההההההההההההההההההההההההההההההההההההההההההההההההההההההההההההההההההההההההההההההההההההההההההההההההההההההההההההההההההההההההההההההההההההההההההההההההההההההההההההההההההההההההההההההההההההההההההההההההההההההההההההההההההההההההההההההההההההההההההההההההההההההההה
XXXXXXXXXXXXXXXXXXXXXXXXXXXXXXXXXXXXXXXXXXXXXXXXXXXXXXXXXXXXXXXXXXXXXXXXXXXXXXXXXXXXXXXXXXXXXXXXXXXXXXXXXXXXXXXXXXXXXXXXXXXXXXXXXXXXXXXXXXXXXXXXXXXXXXXXXXXXXXXXXXXXXXXXXXXXXXXXXXXXXXXXXXXXXXXXXXXXXXXXXXXXXXXXXXXXXXXXXXXXXXXXXXXXXXXXXXXXXXXXXXXXXXXXXXXXXXXX
but the result is not right because x1 and C(x1) occur on 2 ticks, x2 and C(x2) on 3 ticks. How can I get the right plot?

Thank you very much for your time.

Recommended reading 2024:

LaTeXguide.org • LaTeX-Cookbook.net • TikZ.org

NEW: TikZ book now 40% off at Amazon.com for a short time.

And: Currently, Packt sells ebooks for $4.99 each if you buy 5 of their over 1000 ebooks. If you choose only a single one, $9.99. How about combining 3 LaTeX books with Python, gnuplot, mathplotlib, Matlab, ChatGPT or other AI books? Epub and PDF. Bundle (3 books, add more for higher discount): https://packt.link/MDH5p

Stefan Kottwitz
Site Admin
Posts: 10324
Joined: Mon Mar 10, 2008 9:44 pm

Symbolic axis values - strange sequence

Post by Stefan Kottwitz »

Hi Gennaro,

welcome to the forum!

With symbolic coordinates, a question may be, what is the x range, the y range, the placement. It may be undefined here, what may explain that labels are randomly chosen. Interesting anyway. What is missing though, is ytick=data and ytick=data.

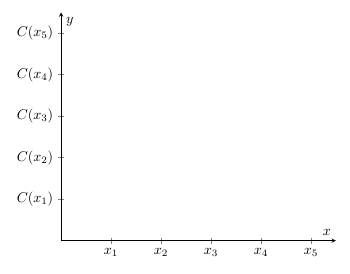
But here is a working solution for you. I take normal coordinates, but symbolic labels, that gives a good picture and using these coordinates you can eve choose fine positions for labels or between symbolic values.

Code: Select all

Code, edit and compile here:
\documentclass[border=10pt]{standalone}
\usepackage{pgfplots}
\begin{document}
\begin{tikzpicture}
\begin{axis}[
xlabel = {$x$},
ylabel = {$y$},
xmin = 0,
xmax = 5.5,
ymin = 0,
ymax = 5.5,
domain = -1:5
y domain = -1:5,
axis lines = center,
xtick = { 1,2,3,4,5 },
ytick = { 1,2,3,4,5 },
xticklabels = { $x_1$, $x_2$, $x_3$, $x_4$, $x_5$ },
yticklabels = { $C(x_1)$, $C(x_2)$, $C(x_3)$,
$C(x_4)$, $C(x_5)$ }
]
\end{axis}
\end{tikzpicture}
\end{document}
הההההההההההההההההההההההההההההההההההההההההההההההההההההההההההההההההההההההההההההההההההההההההההההההההההההההההההההההההההההההההההההההההההההההההההההההההההההההההההההההההההההההההההההההההההההההההההההההההההההההההההההההההההההההההההההההההההההההההההההההההההההההההההההההה
XXXXXXXXXXXXXXXXXXXXXXXXXXXXXXXXXXXXXXXXXXXXXXXXXXXXXXXXXXXXXXXXXXXXXXXXXXXXXXXXXXXXXXXXXXXXXXXXXXXXXXXXXXXXXXXXXXXXXXXXXXXXXXXXXXXXXXXXXXXXXXXXXXXXXXXXXXXXXXXXXXXXXXXXXXXXXXXXXXXXXXXXXXXXXXXXXXXXXXXXXXXXXXXXXXXXXXXXXXXXXXXXXXXXXXXXXXXXXXXXXXXXXXXXXXXXXXXX
plot.png
plot.png (11.31 KiB) Viewed 3929 times
Stefan
LaTeX.org admin
esdd
Posts: 36
Joined: Sat Jan 25, 2014 9:13 pm

Symbolic axis values - strange sequence

Post by esdd »

Post Reply